Introduction
Imagine you are visiting a museum. A guided tour application (which helps you discover the museum) for your mobile phone is provided by the museum.
The application will provide information about the exhibits inside the museum based on your location.
The application will display the exhibits you can visit within a radius of your location. The exhibits which are outside of the radius will not be displayed on the smartphone.
The smartphone identifies its location inside the museum based on the signal it receives from the access points installed in the building.
Additionally, the application will display the distance the visitor walked into the museum.
The behaviour of the application will be implemented using NS‐3.
The project includes:
1. Finding the distance between the client and access point.
2. Finding client’s coordinates using trilateration.
3. Trilateration error.
4. Detecting exhibits the client can visit within a specific radius.
5. Printing the distance visitor travelled.
Finding the distance between the client and access point
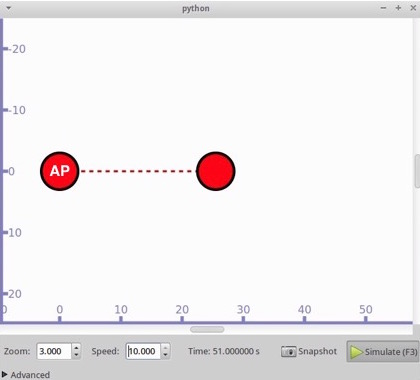
Consider one visitor and one access point (AP) inside the museum. As the visitor approaches and leaves the AP’s area the strength of the signal the visitor receives from the AP modifies.
The formula to calculate distances was simplified because AP’s coordinates are x=0.0, y=0.0
|
1 2 3 4 5 6 7 8 9 10 11 12 13 14 15 16 17 18 19 20 21 22 23 24 25 26 27 28 29 30 31 32 33 34 35 36 37 38 39 40 41 42 43 44 45 46 47 48 49 50 51 52 53 54 55 56 57 58 59 60 61 62 63 64 65 66 67 68 69 70 71 72 73 74 75 76 77 78 79 80 81 82 83 84 85 86 87 88 89 90 91 92 93 94 95 96 97 98 99 100 101 102 103 104 105 106 107 108 109 110 111 112 113 114 115 116 117 118 119 120 121 122 123 124 125 126 127 128 129 130 131 132 133 134 135 136 137 138 139 140 141 142 143 144 145 146 147 148 149 150 151 152 153 154 155 156 157 158 159 160 161 162 163 164 165 166 167 168 169 170 171 172 173 174 175 176 177 178 179 180 181 182 183 184 185 186 187 188 189 190 191 192 193 194 195 196 197 198 199 200 201 202 203 |
/* -*- Mode: C++; c-file-style: "gnu"; indent-tabs-mode:nil; -*- */ #include <fstream> #include <iostream> #include <string> #include "ns3/core-module.h" #include "ns3/network-module.h" #include "ns3/internet-module.h" #include "ns3/wifi-module.h" #include "ns3/mobility-module.h" #include "ns3/applications-module.h" #include "ns3/ipv4-global-routing-helper.h" using namespace ns3; NS_LOG_COMPONENT_DEFINE("Assignment"); static bool g_verbose = true; static std::string mac_sa; static std::string power; static Ptr<Node> n; double distance; static void SetPosition(Ptr<Node> node, Vector position) { Ptr<MobilityModel> mobility = node->GetObject<MobilityModel>(); mobility->SetPosition(position); } static Vector GetPosition(Ptr<Node> node) { Ptr<MobilityModel> mobility = node->GetObject<MobilityModel>(); return mobility->GetPosition(); } static void AdvancePosition(Ptr<Node> node) { Vector pos = GetPosition(node); pos.x += 0.5; SetPosition(node, pos); Simulator::Schedule(Seconds(1.0), &AdvancePosition, node); } static void PrintCurrentPosition(Ptr<Node> node) { Vector pos = GetPosition(node); NS_LOG_UNCOND ("Current Position: x=" << pos.x << " y=" << pos.y << " MAC SA= "<<mac_sa << " Power: " << power); Simulator::Schedule(Seconds(1.0), &PrintCurrentPosition, node); } static void AssocTrace(std::string context, Mac48Address address) { NS_LOG_UNCOND("Associated with AP"); } static void WifiPhyRx(std::string context, Ptr<const Packet> packet, uint16_t channelFreqMhz, uint16_t channelNumber, uint32_t rate, bool isShortPreamble, double signalDbm, double noiseDbm) { Ptr<Packet> p_copy = packet->Copy(); std::ostringstream os; p_copy->Print(os); // std::cout << os.str() ; std::string packetinfo = os.str(); // NS_LOG_UNCOND(p_copy->GetSize() << " - " << packetinfo << signalDbm << " ceva"); std::string str_mngmt_beacon="MGT_BEACON"; std::size_t beacon_found = os.str().find(str_mngmt_beacon); std::ostringstream strs; strs << signalDbm; std::string signalDbm_str = strs.str(); if (beacon_found!=std::string::npos) { // NS_LOG_UNCOND("Beacon Received"); std::string str_sa="SA="; std::size_t sa_found = os.str().find(str_sa); std::string str_sa_msc="ff:ff:ff:ff:ff:ff"; str_sa_msc = os.str().substr(sa_found+3,17); mac_sa=str_sa_msc; power=signalDbm_str; distance=sqrt(GetPosition(n).y * GetPosition(n).y + GetPosition(n).x * GetPosition(n).x); NS_LOG_UNCOND(distance << " " << signalDbm_str); } } int main(int argc, char *argv[]) { CommandLine cmd; cmd.AddValue("verbose", "Print trace information if true", g_verbose); cmd.Parse(argc, argv); remove("ass4_tpVsTime.txt"); remove("ass4_tpVsDistanceToAp.txt"); remove("ass4_modulation.txt"); int standard = 2; // 0 = a, 1 = b, 2 = g double simulation_time = 370.0; //g // enable rts cts all the time. Config::SetDefault("ns3::WifiRemoteStationManager::RtsCtsThreshold", StringValue("0")); // disable fragmentation Config::SetDefault("ns3::WifiRemoteStationManager::FragmentationThreshold", StringValue("2200")); NS_LOG_INFO ("Create nodes."); NodeContainer ap; //all AP nodes NodeContainer stas; //all station nodes stas.Create(1); n=stas.Get(0); ap.Create(1); NS_LOG_INFO ("Set Standard."); WifiHelper wifi = WifiHelper::Default(); if (standard == 0) { wifi.SetStandard(WIFI_PHY_STANDARD_80211a); } else if (standard == 1) { wifi.SetStandard(WIFI_PHY_STANDARD_80211b); } else { wifi.SetStandard(WIFI_PHY_STANDARD_80211g); } YansWifiPhyHelper wifiPhy = YansWifiPhyHelper::Default(); YansWifiChannelHelper wifiChannel = YansWifiChannelHelper::Default(); wifiPhy.SetChannel(wifiChannel.Create()); wifiPhy.Set("TxPowerEnd",DoubleValue (-5.0206)); wifiPhy.Set("TxPowerStart",DoubleValue (-5.0206)); NqosWifiMacHelper wifiMac = NqosWifiMacHelper::Default(); wifi.SetRemoteStationManager("ns3::ArfWifiManager"); Ssid ssid = Ssid("museum"); // setup stas. NetDeviceContainer staDevs, apDevs; wifiMac.SetType("ns3::StaWifiMac", "Ssid", SsidValue(ssid), "ActiveProbing", BooleanValue(false)); staDevs = wifi.Install(wifiPhy, wifiMac, stas); // setup ap. wifiMac.SetType("ns3::ApWifiMac", "Ssid", SsidValue(ssid), "EnableBeaconJitter", BooleanValue(true), "BeaconInterval", TimeValue (Seconds (1))); apDevs = wifi.Install(wifiPhy, wifiMac, ap); NS_LOG_INFO ("Set Positions:"); MobilityHelper mobility; mobility.SetMobilityModel("ns3::ConstantPositionMobilityModel"); mobility.Install(stas); mobility.Install(ap); SetPosition(ap.Get(0), Vector(0.0, 0.0, 0.0)); // SetPosition(ap.Get(1), Vector(200.0, 00.0, 0.0)); // SetPosition(ap.Get(2), Vector(400.0, 0.0, 0.0)); mobility.SetPositionAllocator ("ns3::GridPositionAllocator","MinX", DoubleValue(0.0),"MinY", DoubleValue (0.0), "DeltaX", DoubleValue (100), "DeltaY", DoubleValue (100), "GridWidth", UintegerValue (4), "LayoutType", StringValue ("RowFirst")); // mobility.Install (ap); // Vector pos = GetPosition(stas.Get(0)); // pos.x = pos.x - 60; // SetPosition(stas.Get(0), pos); InternetStackHelper stack; stack.Install(ap); stack.Install(stas); NS_LOG_INFO ("Assign IP Addresses:"); Ipv4AddressHelper ipv4; ipv4.SetBase("10.1.1.0", "255.255.255.0"); Ipv4InterfaceContainer i = ipv4.Assign(staDevs); ipv4.Assign(apDevs); Simulator::Schedule(Seconds(1.0), &AdvancePosition, stas.Get(0)); Config::Connect("/NodeList/*/DeviceList/*/$ns3::WifiNetDevice/Mac/$ns3::StaWifiMac/Assoc", MakeCallback(&AssocTrace)); Config::Connect("/NodeList/0/DeviceList/*/$ns3::WifiNetDevice/Phy/MonitorSnifferRx", MakeCallback(&WifiPhyRx)); NS_LOG_INFO ("Run Simulation."); Simulator::Stop(Seconds(simulation_time)); Simulator::Run(); Simulator::Destroy(); NS_LOG_INFO ("Done."); return 0; } |
Finding client’s coordinates using trilateration.
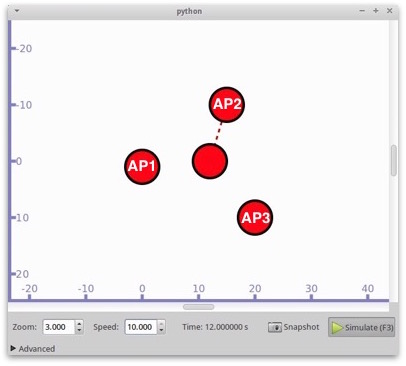
Consider one visitor and a grid of APs. The visitor senses the signal received from all the surrounding APs. Using the outputted data from the previous task we calculate the location of the client using trilateration.
calculateTrilateration() method
|
1 2 3 4 5 6 7 8 9 10 11 12 13 14 15 16 17 18 19 20 21 22 23 24 25 26 27 28 29 30 31 32 33 34 35 36 37 38 39 40 41 42 43 44 45 46 47 48 |
//Calculate the location of the moving node using Trilateration void calculateTrilateration () { if (g_mapBeacons.size()>=3){ //your code here std::vector<double> distances_vector; std::vector<coordinates> coordinates_vector; std::map<std::string,std::string>::iterator it; //iteration through g_mapBeacons for (it=g_mapBeacons.begin(); it!=g_mapBeacons.end(); it++) { //MAC address std::string mac_address = it->first; //power std::string power_dbm = it->second; //print MAC address and power NS_LOG_UNCOND (mac_address << " => " << power_dbm); // iterating through g_powers for (uint i_v = 0; i_v<g_powers.size(); i_v++) { double beaconPower = std::atof(power_dbm.c_str()); //conversion from string to double if (g_powers[i_v] < beaconPower) { NS_LOG_UNCOND(mac_address<< " => " << power_dbm << " => " << g_powers[i_v] << " => " << g_distances[i_v]); distances_vector.push_back(g_distances[i_v]); coordinates_vector.push_back(g_mapApLocations[it->first]); break; } } } NS_LOG_UNCOND ("Printing the three distances"); for (int i=0;i<3;i++) { NS_LOG_UNCOND ("Coordinates of the AP ( x = "<< coordinates_vector[i].x << " y = "<< coordinates_vector[i].y << " ) distance between this AP and mobile node = " <<distances_vector[i] ); } |
The g_mapBeacons map stores MAC address and signal strength of the APs sending beacons. Each time client node receives a beacon g_mapBeacons map is updated. Knowing the power we are able to tell the distance between client and AP. We iterate through the map. For every power, we want to find the corresponding distance. Then the program takes the data from the map and saves it into a variable. We know the only power of the signal from APs, so we check with data from task 1 (loaded from powerToDistanceMaping.dat file) what is the corresponding distance. We loop through g_powers to find value, which is very close. The distances_vector stores identified distances. The coordinates_vector stores coordinates of AP’s MAC address which send the beacon. When we find the value of the distance which is very close to the one we are looking for, we break from the loop.
|
1 2 3 4 5 6 7 8 9 10 11 12 13 14 15 16 17 18 19 20 21 22 23 24 25 26 27 28 29 30 31 32 33 34 35 36 37 38 |
// TRILATERATION FORMULA !!! double xa = coordinates_vector[0].x; double ya = coordinates_vector[0].y; double xb = coordinates_vector[1].x; double yb = coordinates_vector[1].y; double xc = coordinates_vector[2].x; double yc = coordinates_vector[2].y; double ad = distances_vector[0]; double bd = distances_vector[1]; double cd = distances_vector[2]; double positionX; double positionY; double s; double t; s = 0.5 * (xc*xc - xb*xb + yc*yc - yb*yb + bd*bd - cd*cd); t = 0.5 * (xa*xa - xb*xb + ya*ya - yb*yb + bd*bd - ad*ad); positionY = ( t * (xb - xc) - s * (xb - xa) ) / ( (ya - yb) * (xb - xc) - (yc - yb) * (xb - xa) ); positionX = ( positionY * (ya - yb) - t ) / (xb - xa); NS_LOG_UNCOND ("Position of the client: " << "X: " << positionX << ", Y: " << positionY ); } else { //print a text that you do not have enough information for location detection NS_LOG_UNCOND ("There is not enough information for location detection"); } //Call this method every X amount of time. Simulator::Schedule(Seconds(1.0), &calculateTrilateration); //clear the map of beacons, otherwise the moving node may use old information g_mapBeacons.clear(); } |
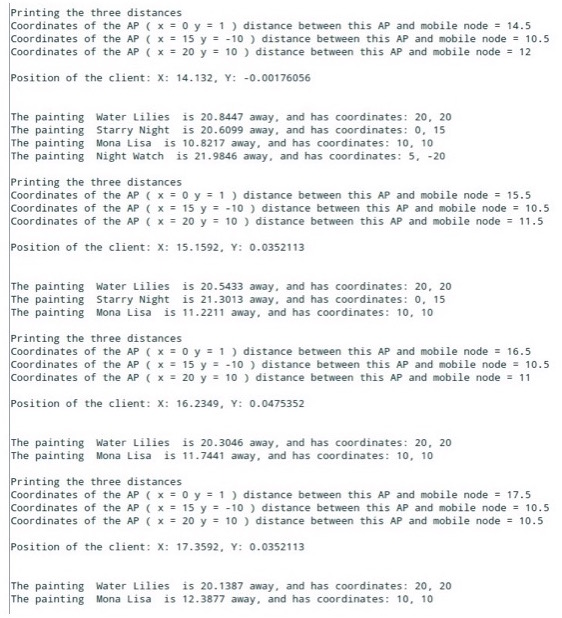
We need coordinates of three access points and distances of ap from client to calculate the position of the client using trilateration formula. The positionX and positionY are variables with coordinates of the client. If the client doesn’t receive enough data – not enough beacons, the message that there is not enough data is printed.
Trilateration error.
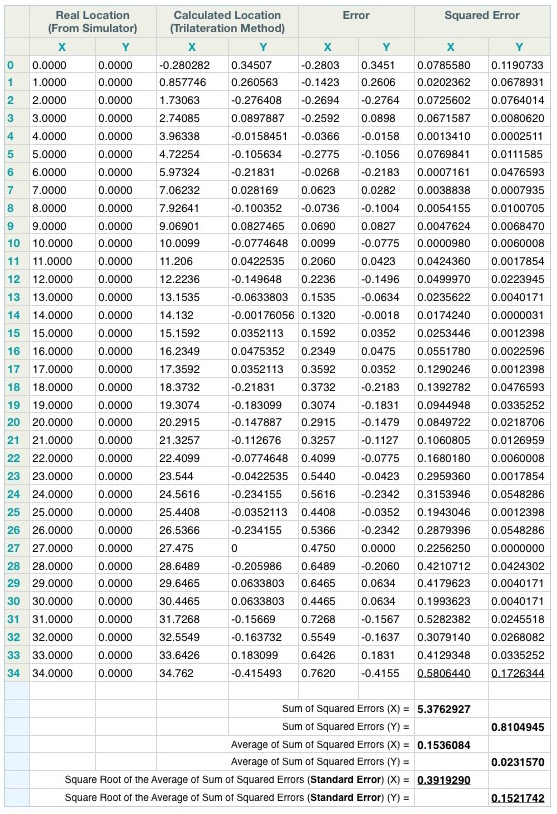
We can draw several conclusions from the comparison of the X and Y coordinates taken from the simulator and calculated by the trilateration method.
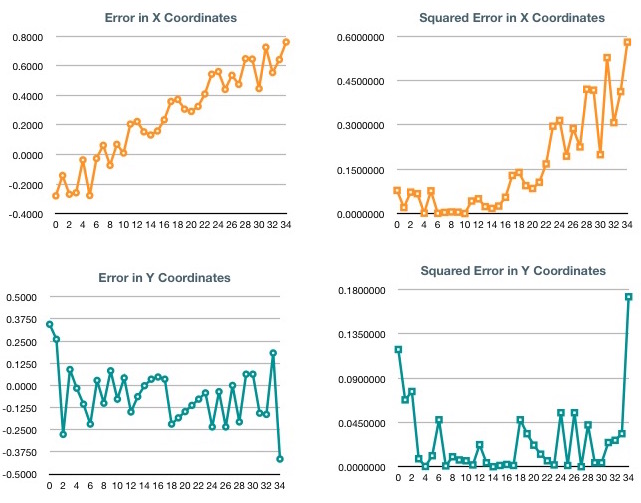
First of all, as the distance increases, the deviation of errors increased as well, mostly in the X coordinates. This is due to the fact that a slight discrepancy in the distance vs signal strength data increases by the distance. Also, the client node was moving away from the beacons, which made the measurements of the X distance increasingly difficult as the angle they looked at the client node started to decrease. In an extreme situation, if the client node was let’s say at coordinates 0,1000, the trilateration would not be that efficient. In an ideal situation, the beacons look at the client node at wider angles to provide better quality. Deviation in Y coordinates was more easily picked up, as two beacons were further away from the X axis (-15, -10 and -20, 10).
Secondly, after calculating the standard error we could clearly see that while we had 0.39193 standard error on the X coordinate, we had only 0.15217 on the Y coordinate.
Thirdly, when measuring the signal strength and various distances in step one, we didn’t have proper measurements at 0.5 and 1.0 meters. These two measurements showed almost no signal strength decrease, which shouldn’t be the case. As we used the chart later to measure the distance of the client node at the trilateration phase, the errors peaked at these distance (see chart ‘Squared error in Y Coordinates’).
We could draw more predictions by running the trilateration several times, thus increasing our data points. More datapoint could provide better feedback, and at a later stage, a correction algorithm could be developed to increase the quality of our trilateration application.
Detecting exhibits the client can visit within a specific radius.
To identify the exhibits within the circle we need to compare the distance between the client and the exhibit to the radius of the circle. If the distance is smaller than the radius, the program will print exhibits, if bigger it will not print them. We can calculate the distance using the same formula like in task 1, using coordinates of the client and coordinates of the exhibits. To save some computing power it is better to compare the sum of squares to the squared radius, instead of using sqrt.
Coordinates x of exhibits are stored in the ex-array, coordinates y in the ey array. The eNames array stores names of exhibits. They all have the same length. We can use for loop to iterate through all three arrays, calculate sumSquares and squared Radius for each position. If statement within for loop checks if the exhibit is inside the circle. If sumSquares is smaller or equal than the squared radius of the circle, the name, distance and coordinates of the exhibit are printed.
|
1 2 3 4 5 6 7 8 9 10 11 12 13 14 15 16 17 18 19 20 21 22 23 24 25 26 |
/**************************************************************/ // DETECTING EXHIBITS IN A CIRCLE void displayExhibits () { double ex[] = {20,0,10,30,5}; //array storing x coords of exhibits double ey[] = {20,15,10,20,-20}; //array storing y coords of exhibits string eNames[] = {"Water Lilies", "Starry Night", "Mona Lisa","Guernica","Night Watch" }; // an array storing names of exhibits double radius = 22.0; // radius of a circle // iterating through exhibits for (int k=0; k<5; k++) { // calculating distances of exhibits from client = sqrt(sumSquares) double sumSquares = (ex[k]-positionX)*(ex[k]-positionX) + (ey[k]-positionY)*(ey[k]-positionY); double sqRadius = radius*radius; // checking if exhibit is inside the circle if (sumSquares<=sqRadius) { // printing exhibits inside the circle NS_LOG_UNCOND ("The painting " << eNames[k] << " is " << sqrt(sumSquares) << " away, and has coordinates: " << ex[k] << ", " << ey[k]); } } Simulator::Schedule(Seconds(1.0), &displayExhibits); } |
Printing the distance visitor travelled.
The client’s positions, calculated by trilateration are stored in the path_vector as a px and py coordinates.
|
1 2 3 4 5 6 |
// Client's positions struct points { double px, py; points (double paramx, double paramy) : px(paramx), py(paramy) {} }; std::vector<points> path_vector; // vector storing client's coordinates calculated with trilateration |
|
1 2 3 4 |
NS_LOG_UNCOND ("\n" << "Position of the client: " << "X: " << positionX << ", Y: " << positionY <<"\n"<<"\n"); // Adding client's coordinates in a path_vector path_vector.push_back(points(positionX, positionY)); |
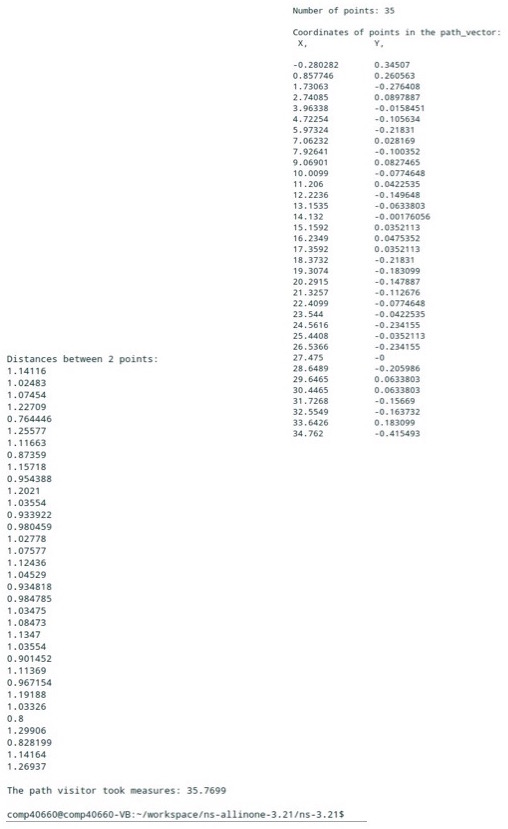
Once the simulation is over, program prints number of points which were detected (added to path_vector), their coordinates and distances between them. At the end, path length is printed.
The same formula as in task 1 was used to calculate distances between points.
To print path length and points, we are iterating with for loop through the path_vector. At each iteration, the distance between two points is calculated and added to the overall path length.
|
1 2 3 4 5 6 7 8 9 10 11 12 13 14 15 16 17 18 19 20 21 22 23 24 25 26 27 28 29 30 31 32 33 34 35 36 37 38 39 |
/************************************************************************/ // PRINTING PATH LENGTH AND DETAILS double path_length = 0; std::cout <<"\n"<< "Number of points: " << int(path_vector.size()) << '\n'<<'\n'; std::cout << "Coordinates of points in the path_vector:" << '\n'; std::cout << " X, Y, " << '\n'<< '\n'; // iteration to print coordintes stored in a path_vector for(unsigned int k=0; k<path_vector.size(); k++) { double x1 = path_vector[k].px; double y1 = path_vector[k].py; std::cout<< x1 <<" "; //Write value of x in first column std::cout<<"\t"; //Jump to next column std::cout<< y1 <<" "; //Write value of y in next column std::cout<<"\n"; } std::cout<<"\n" << "Distances between 2 points: " << '\n'; //iteration to print distances between points stored in path_vector //path will be calculated starting from the first point detected with trilateration for(unsigned int i=1; i<path_vector.size(); i++) { double x0 = path_vector[i-1].px; double y0 = path_vector[i-1].py; double x1 = path_vector[i].px; double y1 = path_vector[i].py; // calculates distance between two points stored in a path_vector double path_distance = sqrt((x1-x0)*(x1-x0)+(y1-y0)*(y1-y0)); std::cout<< path_distance; //Write values of distances between points std::cout<<endl; path_length += path_distance; //add distance between two points to the path length } // print path length std::cout << '\n' << "The path visitor took measures: " << path_length << '\n'<<endl; |
Program
|
1 2 3 4 5 6 7 8 9 10 11 12 13 14 15 16 17 18 19 20 21 22 23 24 25 26 27 28 29 30 31 32 33 34 35 36 37 38 39 40 41 42 43 44 45 46 47 48 49 50 51 52 53 54 55 56 57 58 59 60 61 62 63 64 65 66 67 68 69 70 71 72 73 74 75 76 77 78 79 80 81 82 83 84 85 86 87 88 89 90 91 92 93 94 95 96 97 98 99 100 101 102 103 104 105 106 107 108 109 110 111 112 113 114 115 116 117 118 119 120 121 122 123 124 125 126 127 128 129 130 131 132 133 134 135 136 137 138 139 140 141 142 143 144 145 146 147 148 149 150 151 152 153 154 155 156 157 158 159 160 161 162 163 164 165 166 167 168 169 170 171 172 173 174 175 176 177 178 179 180 181 182 183 184 185 186 187 188 189 190 191 192 193 194 195 196 197 198 199 200 201 202 203 204 205 206 207 208 209 210 211 212 213 214 215 216 217 218 219 220 221 222 223 224 225 226 227 228 229 230 231 232 233 234 235 236 237 238 239 240 241 242 243 244 245 246 247 248 249 250 251 252 253 254 255 256 257 258 259 260 261 262 263 264 265 266 267 268 269 270 271 272 273 274 275 276 277 278 279 280 281 282 283 284 285 286 287 288 289 290 291 292 293 294 295 296 297 298 299 300 301 302 303 304 305 306 307 308 309 310 311 312 313 314 315 316 317 318 319 320 321 322 323 324 325 326 327 328 329 330 331 332 333 334 335 336 337 338 339 340 341 342 343 344 345 346 347 348 349 350 351 352 353 354 355 356 357 358 359 360 361 362 363 364 365 366 367 368 369 370 371 372 373 374 375 376 377 378 379 380 381 382 383 384 385 386 387 388 389 390 391 392 393 394 395 396 397 398 399 400 401 402 403 404 405 406 407 408 409 410 411 412 413 414 415 416 417 418 419 420 421 422 423 424 425 426 427 428 429 430 431 432 433 434 435 436 437 438 |
/* -*- Mode: C++; c-file-style: "gnu"; indent-tabs-mode:nil; -*- */ #include <fstream> #include <iostream> #include <string> #include <cstring> #include "ns3/core-module.h" #include "ns3/network-module.h" #include "ns3/internet-module.h" #include "ns3/wifi-module.h" #include "ns3/mobility-module.h" #include "ns3/applications-module.h" #include "ns3/ipv4-global-routing-helper.h" using namespace std; using namespace ns3; NS_LOG_COMPONENT_DEFINE("Assignment"); static bool g_verbose = true; static std::string mac_sa; static std::string power; static Ptr<Node> n; double positionX; // stores coordinate x of client double positionY; // stores coordinate y of client // AP coordinates struct coordinates { double x; double y; }; static std::map<std::string, coordinates > g_mapApLocations; // Client's positions struct points { double px, py; points (double paramx, double paramy) : px(paramx), py(paramy) {} }; std::vector<points> path_vector; // vector storing client's coordinates calculated with trilateration //this vector stores the distances static std::vector<double> g_distances; //this vector stores the power [dbm] static std::vector<double> g_powers; //this map stores value pairs [MAC,power], where MAC is a unique value //e.g. [00:00:00:00:00:01,-96] static std::map<std::string, std::string> g_mapBeacons; static void SetPosition(Ptr<Node> node, Vector position) { Ptr<MobilityModel> mobility = node->GetObject<MobilityModel>(); mobility->SetPosition(position); } static Vector GetPosition(Ptr<Node> node) { Ptr<MobilityModel> mobility = node->GetObject<MobilityModel>(); return mobility->GetPosition(); } static void AdvancePosition(Ptr<Node> node) { Vector pos = GetPosition(node); pos.x += 1; SetPosition(node, pos); Simulator::Schedule(Seconds(1.0), &AdvancePosition, node); } static void PrintCurrentPosition(Ptr<Node> node) { Vector pos = GetPosition(node); NS_LOG_UNCOND ("Current Position: x=" << pos.x << " y=" << pos.y << " MAC SA= "<<mac_sa << " Power: " << power); Simulator::Schedule(Seconds(1.0), &PrintCurrentPosition, node); } static void AssocTrace(std::string context, Mac48Address address) { NS_LOG_UNCOND("Associated with AP"); } static void WifiPhyRx(std::string context, Ptr<const Packet> packet, uint16_t channelFreqMhz, uint16_t channelNumber, uint32_t rate, bool isShortPreamble, double signalDbm, double noiseDbm) { Ptr<Packet> p_copy = packet->Copy(); std::ostringstream os; p_copy->Print(os); // std::cout << os.str() ; std::string packetinfo = os.str(); // NS_LOG_UNCOND(p_copy->GetSize() << " - " << packetinfo << signalDbm << " ceva"); std::string str_mngmt_beacon="MGT_BEACON"; std::size_t beacon_found = os.str().find(str_mngmt_beacon); std::ostringstream strs; strs << signalDbm; std::string signalDbm_str = strs.str(); if (beacon_found!=std::string::npos) { // NS_LOG_UNCOND("Beacon Received"); std::string str_sa="SA="; std::size_t sa_found = os.str().find(str_sa); std::string str_sa_msc="ff:ff:ff:ff:ff:ff"; str_sa_msc = os.str().substr(sa_found+3,17); mac_sa=str_sa_msc; power=signalDbm_str; //update the g_mapBeacons with the newly received beacon information g_mapBeacons[mac_sa] = power; // NS_LOG_UNCOND("x:" << GetPosition(n).x << ":y:" <<GetPosition(n).y << ":MAC:" << str_sa_msc << ":Power[dBm]:" << signalDbm_str); } } //Calculate the location of the moving node using Trilateration /**************************************************************/ // FINDING CLIENT'S COORDINATES WITH TRILATERATION void calculateTrilateration () { if (g_mapBeacons.size()>=3){ //your code here std::vector<double> distances_vector; std::vector<coordinates> coordinates_vector; std::map<std::string,std::string>::iterator it; //iteration through g_mapBeacons for (it=g_mapBeacons.begin(); it!=g_mapBeacons.end(); it++) { //MAC address std::string mac_address = it->first; //power std::string power_dbm = it->second; //print MAC address and power // NS_LOG_UNCOND (mac_address << " => " << power_dbm); // iterating through g_powers for (uint i_v = 0; i_v<g_powers.size(); i_v++) { double beaconPower = std::atof(power_dbm.c_str()); //conversion from string to double if (g_powers[i_v] < beaconPower) { // NS_LOG_UNCOND(mac_address<< " => " << power_dbm << " => " << g_powers[i_v] << " => " << g_distances[i_v]); distances_vector.push_back(g_distances[i_v]); coordinates_vector.push_back(g_mapApLocations[it->first]); break; } } } NS_LOG_UNCOND ("\n" << "Printing the three distances"); for (int i=0;i<3;i++) { NS_LOG_UNCOND ("Coordinates of the AP ( x = "<< coordinates_vector[i].x << " y = "<< coordinates_vector[i].y << " ) distance between this AP and mobile node = " <<distances_vector[i] ); } // TRILATERATION FORMULA !!! double xa = coordinates_vector[0].x; double ya = coordinates_vector[0].y; double xb = coordinates_vector[1].x; double yb = coordinates_vector[1].y; double xc = coordinates_vector[2].x; double yc = coordinates_vector[2].y; double ad = distances_vector[0]; double bd = distances_vector[1]; double cd = distances_vector[2]; double s; double t; s = 0.5 * (xc*xc - xb*xb + yc*yc - yb*yb + bd*bd - cd*cd); t = 0.5 * (xa*xa - xb*xb + ya*ya - yb*yb + bd*bd - ad*ad); positionY = ( t * (xb - xc) - s * (xb - xa) ) / ( (ya - yb) * (xb - xc) - (yc - yb) * (xb - xa) ); positionX = ( positionY * (ya - yb) - t ) / (xb - xa); NS_LOG_UNCOND ("\n" << "Position of the client: " << "X: " << positionX << ", Y: " << positionY <<"\n"<<"\n"); // Adding client's coordinates in a path_vector path_vector.push_back(points(positionX, positionY)); } else { //print a text saying that you do not have enough information for location detection NS_LOG_UNCOND ("\n" << "There is not enough information for location detection" <<"\n"); } //TODO: write the code to call this method every X amount of time. Simulator::Schedule(Seconds(1.0), &calculateTrilateration); //clear the map of beacons, otherwise the moving node may use old information g_mapBeacons.clear(); } /**************************************************************/ // METHOD DETECTING EXHIBITS IN A CIRCLE void displayExhibits () { double ex[] = {20,0,10,30,5}; // an array storing x coordinates of exhibits double ey[] = {20,15,10,20,-20}; // an array storing y coordinates of exhibits string eNames[] = {"Water Lilies", "Starry Night", "Mona Lisa","Guernica","Night Watch" }; // an array storing names of exhibits double radius = 22.0; // radius of a circle // iterating through exhibits for (int k=0; k<5; k++) { // calculating distances of exhibits from client = sqrt(sumSquares) double sumSquares = (ex[k]-positionX)*(ex[k]-positionX) + (ey[k]-positionY)*(ey[k]-positionY); double sqRadius = radius*radius; // checking if exhibit is inside the circle if (sumSquares<=sqRadius) { // printing exhibits inside the circle NS_LOG_UNCOND ("The painting " << eNames[k] << " is " << sqrt(sumSquares) << " away, and has coordinates: " << ex[k] << ", " << ey[k]); } } Simulator::Schedule(Seconds(1.0), &displayExhibits); } //reads content from file (coordinates, power) void LoadPowerDistanceMapping (std::string filename) { double distance, power; std::ifstream ifTraceFile; ifTraceFile.open (filename.c_str (), std::ifstream::in); g_distances.clear (); g_powers.clear(); if (!ifTraceFile.good ()) { NS_LOG_UNCOND("Something wrong with the file."); } while (ifTraceFile.good ()) { ifTraceFile >> distance >> power; g_distances.push_back (distance); g_powers.push_back(power); NS_LOG_UNCOND(distance << " " << power); } ifTraceFile.close (); } int main(int argc, char *argv[]) { CommandLine cmd; cmd.AddValue("verbose", "Print trace information if true", g_verbose); cmd.Parse(argc, argv); remove("ass4_tpVsTime.txt"); remove("ass4_tpVsDistanceToAp.txt"); remove("ass4_modulation.txt"); int standard = 2; // 0 = a, 1 = b, 2 = g double simulation_time = 34.0; //g //Call here the LoadPowerDistanceMapping(filename); LoadPowerDistanceMapping("./scratch/powerToDistanceMaping.dat"); // enable rts cts all the time. Config::SetDefault("ns3::WifiRemoteStationManager::RtsCtsThreshold", StringValue("0")); // disable fragmentation Config::SetDefault("ns3::WifiRemoteStationManager::FragmentationThreshold", StringValue("2200")); NS_LOG_INFO ("Create nodes."); NodeContainer ap; //all AP nodes NodeContainer stas; //all station nodes stas.Create(1); n=stas.Get(0); ap.Create(3); NS_LOG_INFO ("Set Standard."); WifiHelper wifi = WifiHelper::Default(); if (standard == 0) { wifi.SetStandard(WIFI_PHY_STANDARD_80211a); } else if (standard == 1) { wifi.SetStandard(WIFI_PHY_STANDARD_80211b); } else { wifi.SetStandard(WIFI_PHY_STANDARD_80211g); } YansWifiPhyHelper wifiPhy = YansWifiPhyHelper::Default(); YansWifiChannelHelper wifiChannel = YansWifiChannelHelper::Default(); wifiPhy.SetChannel(wifiChannel.Create()); wifiPhy.Set("TxPowerEnd",DoubleValue (-5.0206)); wifiPhy.Set("TxPowerStart",DoubleValue (-5.0206)); NqosWifiMacHelper wifiMac = NqosWifiMacHelper::Default(); wifi.SetRemoteStationManager("ns3::ArfWifiManager"); Ssid ssid = Ssid("museum"); // setup stas. NetDeviceContainer staDevs, apDevs; wifiMac.SetType("ns3::StaWifiMac", "Ssid", SsidValue(ssid), "ActiveProbing", BooleanValue(false)); staDevs = wifi.Install(wifiPhy, wifiMac, stas); // setup ap. wifiMac.SetType("ns3::ApWifiMac", "Ssid", SsidValue(ssid), "EnableBeaconJitter", BooleanValue(true), "BeaconInterval", TimeValue (Seconds (1.0))); apDevs = wifi.Install(wifiPhy, wifiMac, ap); NS_LOG_INFO ("Set Positions:"); MobilityHelper mobility; mobility.SetMobilityModel("ns3::ConstantPositionMobilityModel"); mobility.Install(stas); mobility.Install(ap); /**************************************************************/ // COORDINATES OF ACCESS POINTS SetPosition(ap.Get(0), Vector(0.0, 1.0, 0.0)); SetPosition(ap.Get(1), Vector(15.0, -10, 0.0)); SetPosition(ap.Get(2), Vector(20.0, 10.0, 0.0)); coordinates a; a.x=0; a.y=1; g_mapApLocations["00:00:00:00:00:02"]=a; coordinates b; b.x=15; b.y=-10; g_mapApLocations["00:00:00:00:00:03"]=b; coordinates c; c.x=20; c.y=10; g_mapApLocations["00:00:00:00:00:04"]=c; InternetStackHelper stack; stack.Install(ap); stack.Install(stas); NS_LOG_INFO ("Assign IP Addresses:"); Ipv4AddressHelper ipv4; ipv4.SetBase("10.1.1.0", "255.255.255.0"); Ipv4InterfaceContainer i = ipv4.Assign(staDevs); ipv4.Assign(apDevs); Simulator::Schedule(Seconds(1.0), &AdvancePosition, stas.Get(0)); //Call the calculateTrilateration() method calculateTrilateration (); // Call displayExhibits method displayExhibits (); Config::Connect("/NodeList/*/DeviceList/*/$ns3::WifiNetDevice/Mac/$ns3::StaWifiMac/Assoc", MakeCallback(&AssocTrace)); Config::Connect("/NodeList/0/DeviceList/*/$ns3::WifiNetDevice/Phy/MonitorSnifferRx", MakeCallback(&WifiPhyRx)); NS_LOG_INFO ("Run Simulation."); Simulator::Stop(Seconds(simulation_time)); Simulator::Run(); Simulator::Destroy(); NS_LOG_INFO ("Done."); /************************************************************************/ // PRINTING PATH LENGTH AND DETAILS double path_length = 0; std::cout <<"\n"<< "Number of points: " << int(path_vector.size()) << '\n'<< '\n'; std::cout << "Coordinates of points in the path_vector:" << '\n'; std::cout << " X, Y, " << '\n'<< '\n'; // iteration to print coordintes stored in a path_vector for(unsigned int k=0; k<path_vector.size(); k++) { double x1 = path_vector[k].px; double y1 = path_vector[k].py; std::cout<< x1 <<" "; //Write value of x in first column std::cout<<"\t"; //Jump to next column std::cout<< y1 <<" "; //Write value of y in next column std::cout<<"\n"; } std::cout<<"\n" << "Distances between 2 points: " << '\n'; // iteration to print distances between points stored in path_vector // path will be calculated starting from the first point detected with trilateration for(unsigned int i=1; i<path_vector.size(); i++) { double x0 = path_vector[i-1].px; double y0 = path_vector[i-1].py; double x1 = path_vector[i].px; double y1 = path_vector[i].py; // calculates distance between two points stored in a path_vector double path_distance = sqrt((x1-x0)*(x1-x0)+(y1-y0)*(y1-y0)); std::cout<< path_distance; //Write values of distances between points std::cout<<endl; path_length += path_distance; // add distance between two points to the path length } // print path length std::cout << '\n' << "The path visitor took measures: " << path_length << '\n'<<endl; return 0; } |
